

A scenario is a set of values that Excel saves and can substitute automatically on your worksheet. You can create and save different groups of values as scenarios and then switch between these scenarios to view the different results.
If several people have specific information that you want to use in scenarios, you can collect the information in separate workbooks, and then merge the scenarios from the different workbooks into one.
After you have all the scenarios you need, you can create a scenario summary report that includes information from all the scenarios.
You manage scenarios with the Scenario Manager from What-If Analysis in the Forecast group on the Data tab.
Kinds of What-If Analysis
Excel includes three kinds of What-If Analysis tools: Scenario Manager, Data Table, and Goal Seek. Scenarios and Data Table take sets of input values and project forward to determine possible results. Goal Seek differs from Scenarios and Data Table in that it takes a result and projects backwards to determine possible input values that produce that result.
Each scenario can accommodate up to 32 variable values. If you want to analyze more than 32 values, and the values represent only one or two variables, you can use Data Tables. Although it's limited to only one or two variables (one for the row input cell and one for the column input cell), a Data Table can include as many different variable values as you want. A scenario can have a maximum of 32 different values, but you can create as many scenarios as you want.
In addition to these three tools, you can install add-ins that help you perform What-If Analysis, such as the Solver add-in. The Solver add-in is similar to Goal Seek, but it can accommodate more variables. You can also create forecasts by using the fill handle and various commands that are built into Excel.
Creating scenarios
Suppose that you want to create a budget but are uncertain of your revenue. By using scenarios, you can define different possible values for the revenue and then switch between scenarios to perform what-if analyses.
For example, assume that your worst case budget scenario is Gross Revenue of $50,000 and Costs of Goods Sold of $13,200, leaving $36,800 in Gross Profit. To define this set of values as a scenario, you first enter the values in a worksheet, as shown in the following illustration:
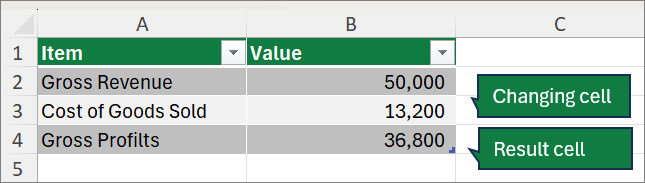
The Changing cells have values that you type in, while the Result cell contains a formula that is based on the Changing cells (in this illustration cell B4 has the formula =B2-B3).
You then use the Scenario Manager dialog to save these values as a scenario. Go to the Data tab, select What-If Analysis, select Scenario Manager, and then select Add.
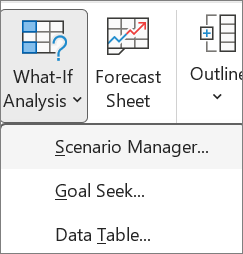
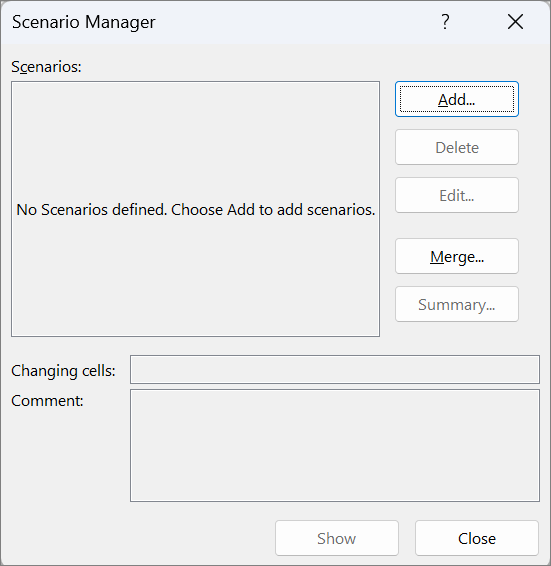
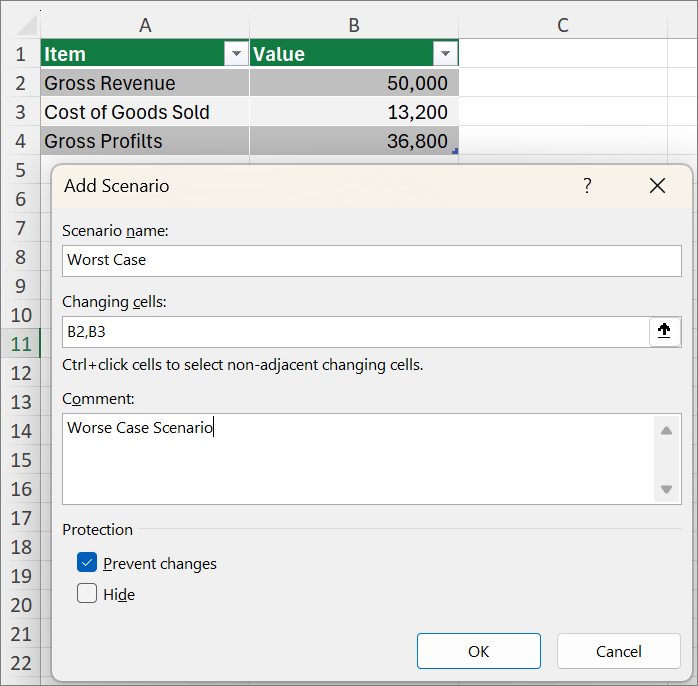
In the Scenario name dialog, name the scenario Worst Case, and specify that cells B2 and B3 are the values that change between scenarios. If you select the Changing cells on your worksheet before adding a Scenario, the Scenario Manager automatically inserts the cells for you. Otherwise, you can type them by hand or use the cell selection dialog to the right of the Changing cells dialog box.
Note
Although this example contains only two changing cells (B2 and B3), a scenario can contain up to 32 cells.
Protection – You can also protect your scenarios. In the Protection section, check the options that you want, or uncheck them if you don't want any protection.
- Select Prevent Changes to prevent editing the scenario when the worksheet is protected.
- Select Hidden to prevent displaying the scenario when the worksheet is protected.
Note
These options apply only to protected worksheets. For more information about protected worksheets, see Protect a worksheet.
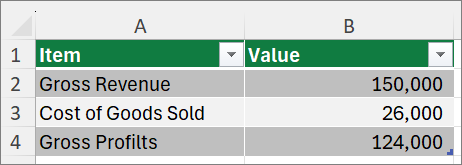
Now suppose that your best case budget scenario is Gross Revenue of $150,000 and Costs of Goods Sold of $26,000, leaving $124,000 in Gross Profit. To define this set of values as a scenario, you create another scenario, name it Best Case, and supply different values for cell B2 (150,000) and cell B3 (26,000). Because Gross Profit (cell B4) is a formula - the difference between Revenue (B2) and Costs (B3) - you don't change cell B4 for the Best Case scenario.
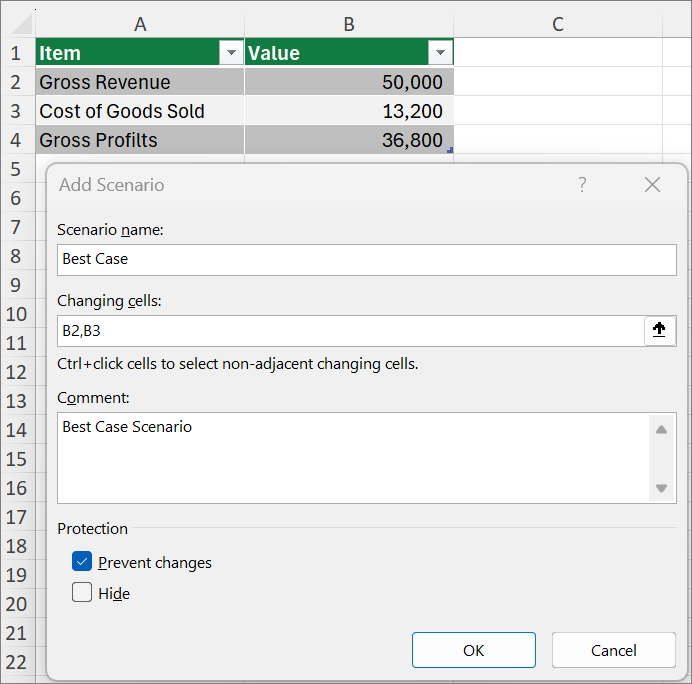
After you save a scenario, it becomes available in the list of scenarios that you can use in your what-if analyses. Given the values in the preceding illustration, if you choose to display the Best Case scenario, the values in the worksheet change to resemble the following illustration:
Merging scenarios
You might have all the information you need in one worksheet or workbook to create the scenarios you want to consider. However, you might want to gather scenario information from other sources. For example, suppose you're trying to create a company budget. You might collect scenarios from different departments, like Sales, Payroll, Production, Marketing, and Legal, because each of these sources has different information to use in creating the budget.
You can gather these scenarios into one worksheet by using the Merge command. Each source can supply as many or as few changing cell values as you want. For example, you might want each department to supply expenditure projections, but only need revenue projections from a few.
When you choose to merge, the Scenario Manager loads a Merge Scenarios dialog box, which lists all of the worksheets in the active workbook, as well as listing any other workbooks you have open at the time. The wizard tells you how many scenarios you have on each source worksheet you select.
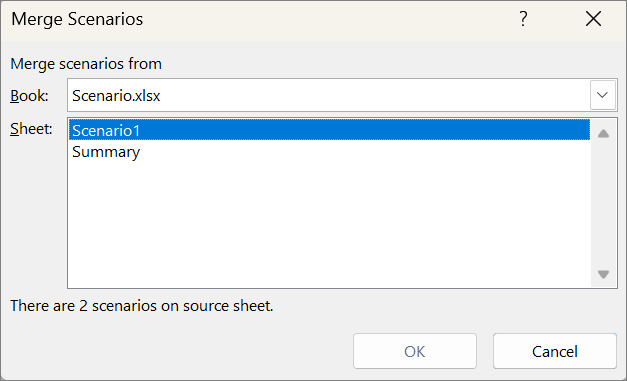
When you collect different scenarios from various sources, use the same cell structure in each of the workbooks. For example, put Revenue always in cell B2 and Expenditures always in cell B3. If you use different structures for the scenarios from various sources, it can be difficult to merge the results.
Tip
Consider first creating a scenario yourself, and then sending your colleagues a copy of the workbook that contains that scenario. This approach makes it easier to ensure that all the scenarios are structured the same way.
Scenario summary reports
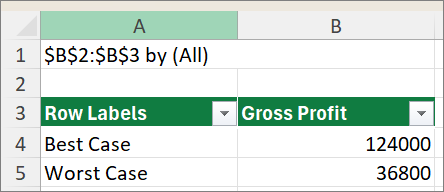
To compare several scenarios, create a report that summarizes them on the same page. The report can list the scenarios side by side or present them in a PivotTable report.
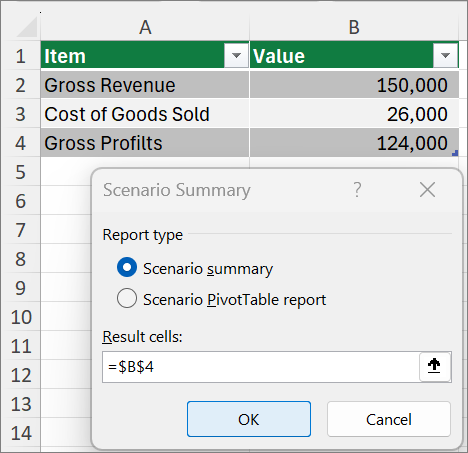
A scenario summary report based on the preceding two example scenarios might look like the following:
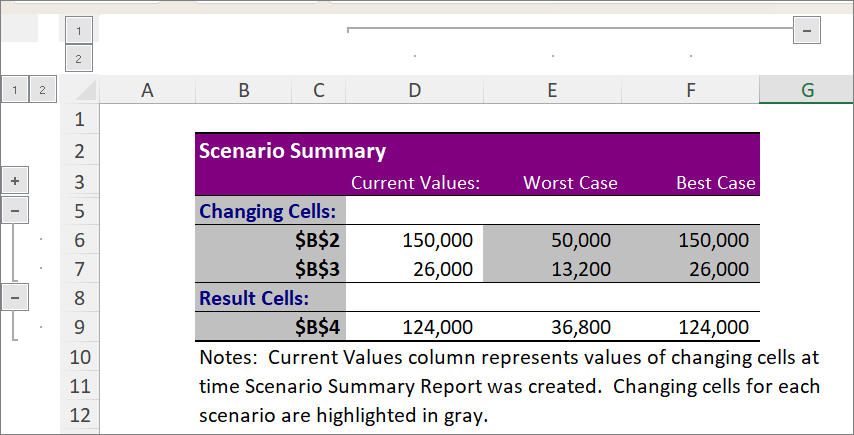
Excel automatically adds Grouping levels, which expand and collapse the view as you select different options.
A note appears at the end of the summary report explaining that the Current Values column represents the values of changing cells when you create the Scenario Summary Report. The cells that changed for each scenario are highlighted in gray.
Note
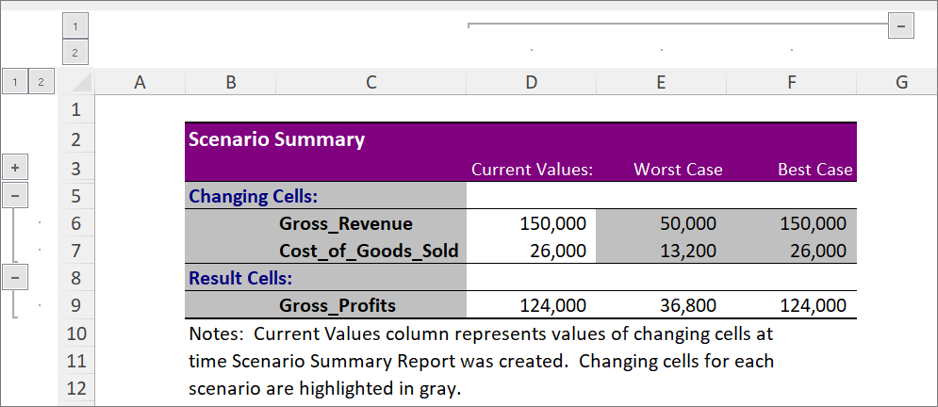
- By default, the summary report uses cell references to identify the changing cells and result cells. If you create named ranges for the cells before you run the summary report, the report contains the names instead of cell references.
- Scenario reports don't automatically recalculate. If you change the values of a scenario, those changes don't show up in an existing summary report. They show up if you create a new summary report.
- You don't need result cells to generate a scenario summary report, but you do need them for a scenario PivotTable report.
Need more help?
You can always ask an expert in the Excel Tech Community or get support in Communities.
See Also
Calculate multiple results by using a data table
Use Goal Seek to find the result you want by adjusting an input value
Introduction to What-If Analysis
Define and solve a problem by using Solver
How to avoid broken formulas in Excel
Detect formula errors in Excel